Author: nrennie.bsky.social (did:plc:jiushxoiyvgcw2tgsjyvd2mc)
Collections
Record🤔
cid:
"bafyreiexw6hbny2cqty2gteshoedxtpd4q5fyi37h5zlkz2bo2doaf46w4"
value:
text:
"Blog post: nrennie.rbind.io/blog/plotnin..."
$type:
"app.bsky.feed.post"
embed:
$type:
"app.bsky.embed.external"
external:
thumb:
View blob content
$type:
"blob"
mimeType:
"image/jpeg"
size:
863263
title:
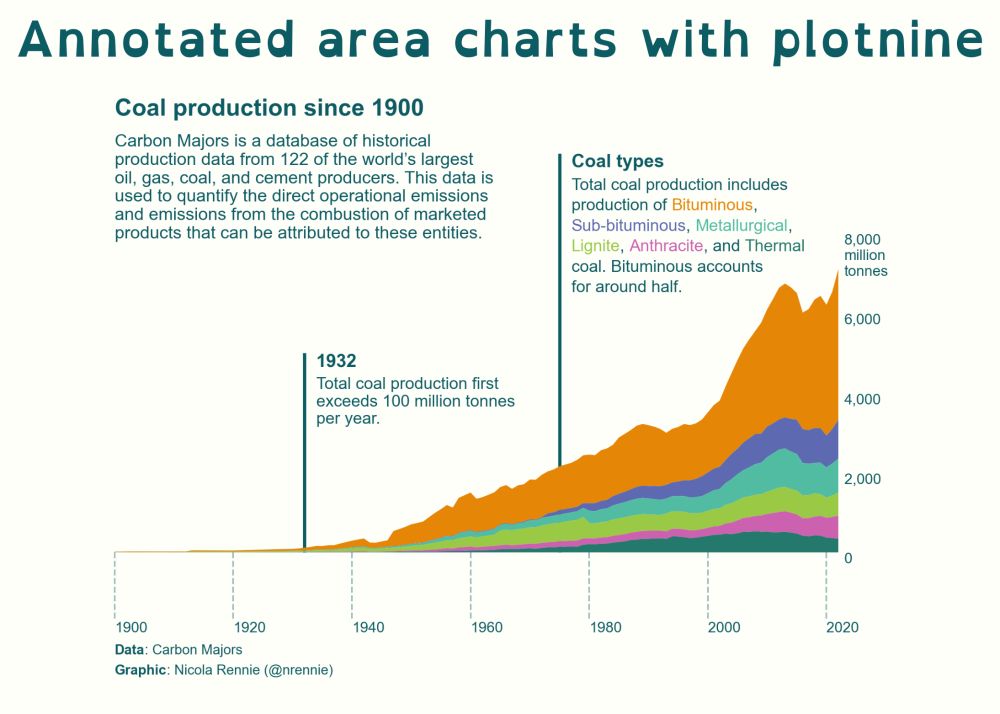
"Annotated area charts with plotnine | Nicola Rennie"
description:
"The `plotnine` visualisation library brings the Grammar of Graphics to Python. This blog post walks through the process of creating a customised, annotated area chart of coal production data."
langs:
"en"
reply:
root:
cid:
"bafyreiekuwy4lsakjcwiapihtouyebq7ffsax5b3t5el3codk5abat4ata"
parent:
cid:
"bafyreiekuwy4lsakjcwiapihtouyebq7ffsax5b3t5el3codk5abat4ata"
facets:
index:
byteEnd:
43
byteStart:
11
features:
$type:
"app.bsky.richtext.facet#link"
createdAt:
"2024-07-11T19:43:23.836Z"