Record🤔
cid:
"bafyreiekuwy4lsakjcwiapihtouyebq7ffsax5b3t5el3codk5abat4ata"
value:
text:
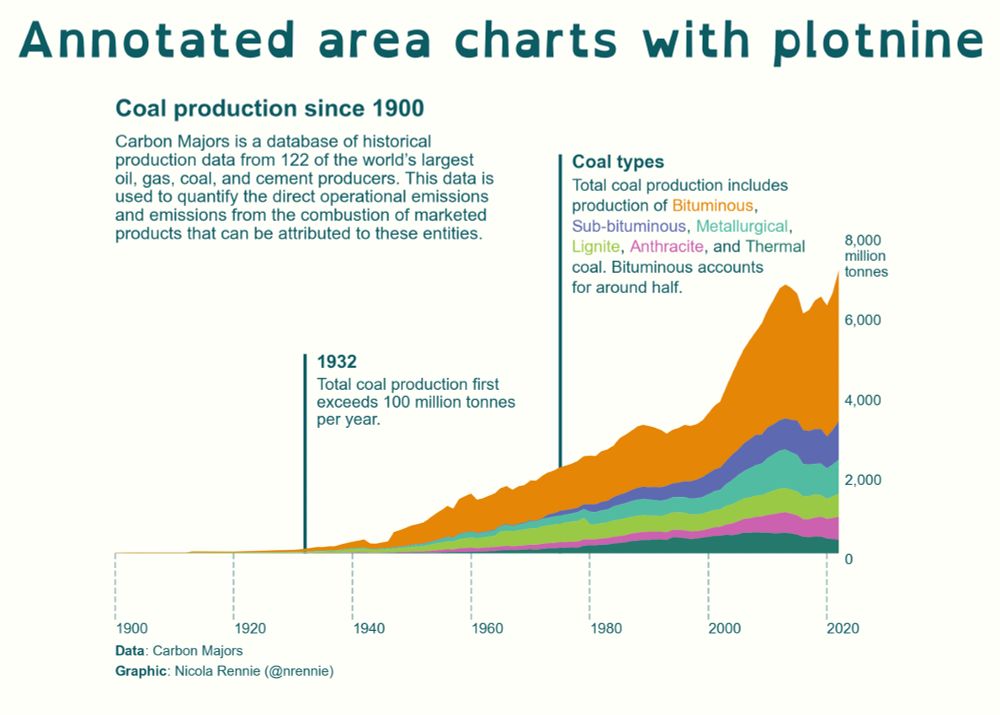
"🚨 New blog post! 🚨

I've written a blog post showing you how to make annotated area charts using plotnine in Python (with a little bit of help from highlight-text and matplotlib) 📊

(possibly of interest to #RStats users who use #ggplot2!)s a subtitle! 📊

Link 👇👇👇

#Python #plotnine #DataViz"
$type:
"app.bsky.feed.post"
embed:
$type:
"app.bsky.embed.images"
images:
alt:
"Area plot of coal production with coloured annotation"
image:
View blob content
$type:
"blob"
mimeType:
"image/jpeg"
size:
898664
aspectRatio:
width:
2000
height:
1429
langs:
"en"
facets:
index:
byteEnd:
223
byteStart:
216
features:
tag:
"RStats"
$type:
"app.bsky.richtext.facet#tag"
index:
byteEnd:
249
byteStart:
238
features:
tag:
"ggplot2!)s"
$type:
"app.bsky.richtext.facet#tag"
index:
byteEnd:
294
byteStart:
287
features:
tag:
"Python"
$type:
"app.bsky.richtext.facet#tag"
index:
byteEnd:
304
byteStart:
295
features:
tag:
"plotnine"
$type:
"app.bsky.richtext.facet#tag"
index:
byteEnd:
313
byteStart:
305
features:
tag:
"DataViz"
$type:
"app.bsky.richtext.facet#tag"
createdAt:
"2024-07-11T19:42:58.752Z"