Author: zlabe.bsky.social (did:plc:nipoqrw2c5olbwkhy3bqxkiy)
Collections
Record🤔
cid:
"bafyreih2ivegy74vfnrxhvtzrxuut2qtk7p42jprwzbf6j275e3bon25eq"
value:
text:
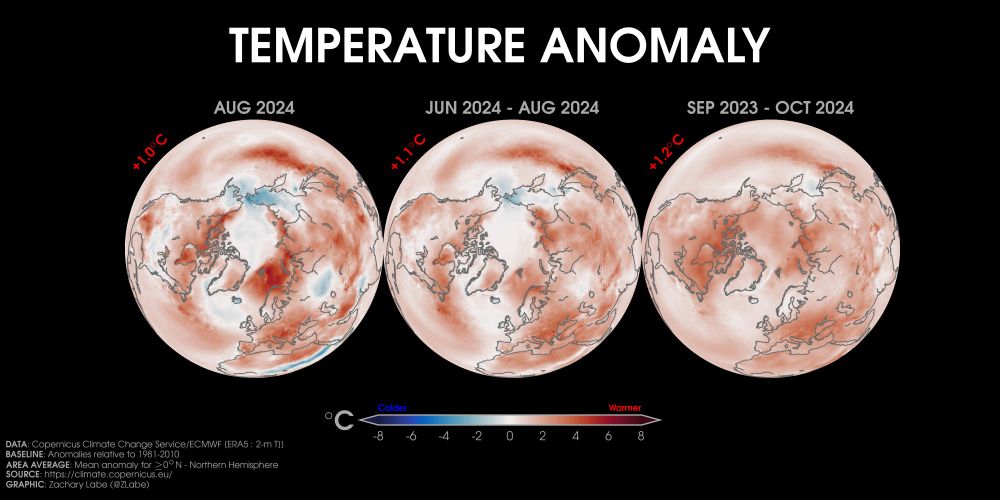
"Temperature anomalies over the last month (left), 3 months (center), and 12 months (right) in the Northern Hemisphere...

Data from @copernicusecmwf.bsky.social  ERA5 reanalysis at cds.climate.copernicus.eu/cdsapp#!/dat..."
$type:
"app.bsky.feed.post"
embed:
$type:
"app.bsky.embed.images"
images:
alt:
"Three orthographic maps showing 2-m air temperature anomalies in August 2024, June 2024 to August 2024, and September 2023 to August 2024. Red shading is shown for warmer anomalies, and blue shading is shown for colder anomalies. Most areas are warmer than average. The mean temperature anomaly for each map is also displayed. Anomalies are calculated relative to a 1981-2010 baseline."
image:
View blob content
$type:
"blob"
mimeType:
"image/jpeg"
size:
279190
aspectRatio:
width:
2000
height:
1000
langs:
"en"
facets:
$type:
"app.bsky.richtext.facet"
index:
byteEnd:
161
byteStart:
133
features:
$type:
"app.bsky.richtext.facet#mention"
index:
byteEnd:
223
byteStart:
182
features:
$type:
"app.bsky.richtext.facet#link"
createdAt:
"2024-09-17T23:22:37.406Z"