Author: zlabe.bsky.social (did:plc:nipoqrw2c5olbwkhy3bqxkiy)
Collections
Record🤔
cid:
"bafyreifkee6z2glywkumydsm5s7ikw3bpckt5uo7qbweowcx7fk7m5wij4"
value:
text:
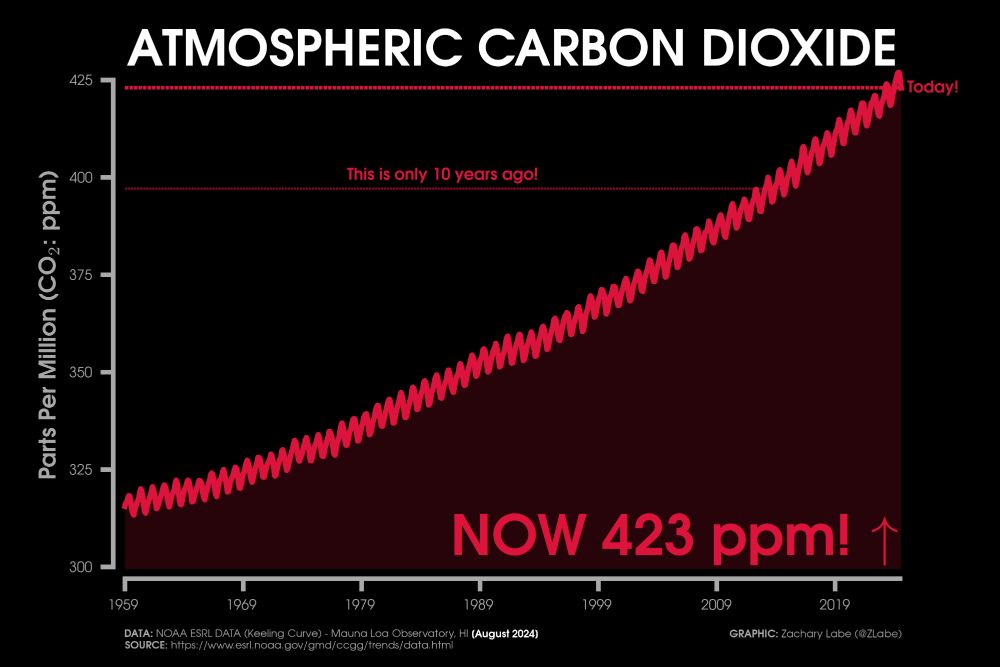
"Carbon dioxide (CO₂) averaged 423 ppm in August 2024

10 years ago August averaged about 397 ppm

Preliminary NOAA data: gml.noaa.gov/ccgg/trends/"
$type:
"app.bsky.feed.post"
embed:
$type:
"app.bsky.embed.images"
images:
alt:
"Red line graph time series of monthly carbon dioxide abundance from January 1959 through August 2024. There is a seasonal cycle and long-term increasing trend. Current levels of CO2 are at 423 ppm. This is the Keeling Curve graph. A line for CO2 10 years ago is also annotated."
image:
View blob content
$type:
"blob"
mimeType:
"image/jpeg"
size:
537123
aspectRatio:
width:
2000
height:
1334
langs:
"en"
facets:
index:
byteEnd:
149
byteStart:
124
features:
$type:
"app.bsky.richtext.facet#link"
createdAt:
"2024-09-14T12:37:23.561Z"