Author: weecology.bsky.social (did:plc:mrarz6ccmzhvxs3hh4bm2snk)
Collections
Record🤔
cid:
"bafyreigdybp4mslcagpkzeex3qnogqks2cp7a3nosz2nod6yllv4hw5qay"
value:
text:
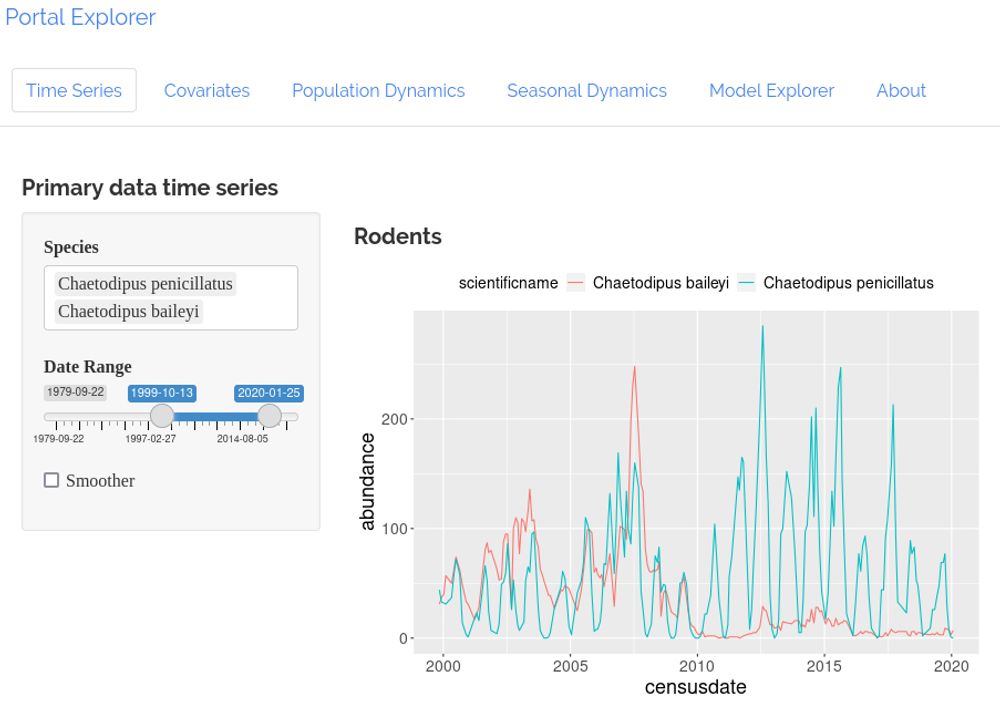
"To make projects on one of our long-term studies easier we built an #rstats Shiny app that lets us visualize and build basic models for dynamics at the site. This lets us iterate more quickly than having to stop and wait while someone does common data viz work portalexplorer.weecology.org 🌎️"
$type:
"app.bsky.feed.post"
embed:
$type:
"app.bsky.embed.images"
images:
alt:
"Screen shot of the Portal Explorer showing tabs for time-series, covariates, population dynamics, etc. Two species and a limited date range are selected and a plot shows the population time-series for those species during the selected range of dates from 2000 to 2020."
image:
View blob content
$type:
"blob"
mimeType:
"image/jpeg"
size:
214089
langs:
"en"
facets:
index:
byteEnd:
289
byteStart:
261
features:
$type:
"app.bsky.richtext.facet#link"
createdAt:
"2023-09-18T14:45:08.681Z"