Record🤔
cid:
"bafyreiccbpr4ked3m3yjoxz7yxlbzlfx3qqq3l6nzauoripahjlwuzrpii"
value:
text:
"A quick #TidyTuesday plot of the 2024 StackOverflow Developer Survey results 📊 I created an alluvial chart, built with {ggalluvial}, which looks at the relationship between developer experience and how likely they are to use AI and believe it is a threat to their job #RStats #DataViz #ggplot2"$type:
"app.bsky.feed.post"
embed:
$type:
"app.bsky.embed.images"
images:
alt:
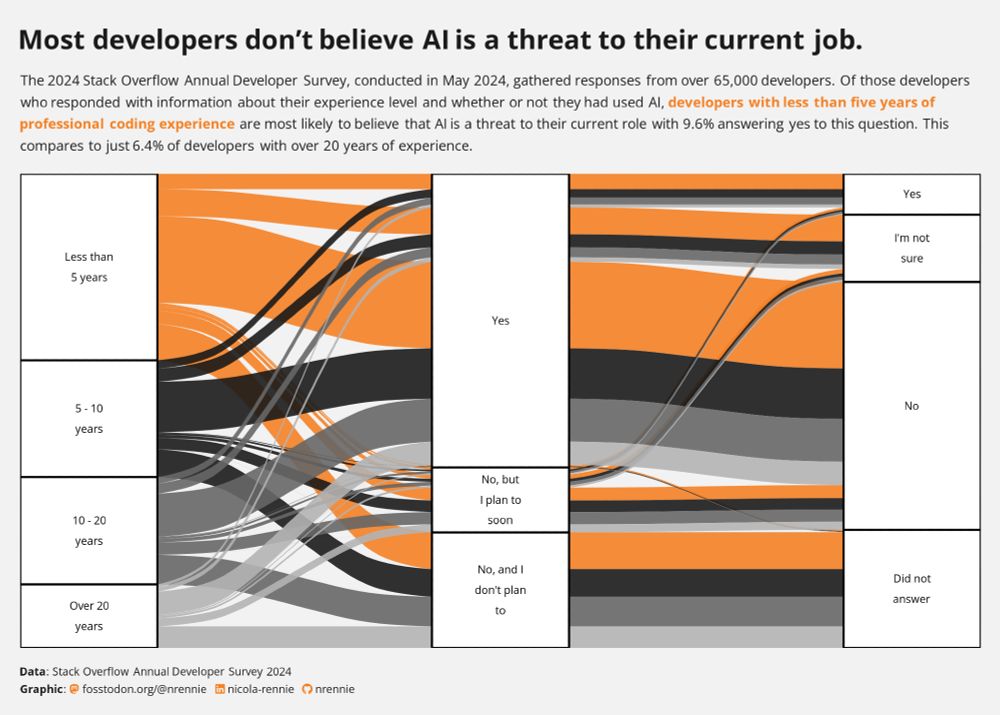
"alluvial chaft showing propertion of developers based on experience level, use of AI, and whether they think it is a threat. Text reads "The 2024 Stack Overflow Annual Developer Survey, conducted in May 2024, gathered responses from over 65,000 developers. Of those developers who responded with information about their experience level and whether or not they had used AI, developers with less than five years of professional coding experience are most likely to believe that AI is a threat to their current role with 9.6% answering yes to this question. This compares to just 6.4% of developers with over 20 years of experience."
image:
View blob content
$type:
"blob"
mimeType:
"image/jpeg"
size:
776926
aspectRatio:
width:
2000
height:
1429
langs:
"en"
facets:
index:
byteEnd:
20
byteStart:
8
features:
tag:
"TidyTuesday"
$type:
"app.bsky.richtext.facet#tag"
index:
byteEnd:
280
byteStart:
273
features:
tag:
"RStats"
$type:
"app.bsky.richtext.facet#tag"
index:
byteEnd:
289
byteStart:
281
features:
tag:
"DataViz"
$type:
"app.bsky.richtext.facet#tag"
index:
byteEnd:
298
byteStart:
290
features:
tag:
"ggplot2"
$type:
"app.bsky.richtext.facet#tag"
createdAt:
"2024-09-05T17:21:09.601Z"