Author: nrennie.bsky.social (did:plc:jiushxoiyvgcw2tgsjyvd2mc)
Collections
Record🤔
cid:
"bafyreihhvdzxh6ttm6ve2vwzuhehcbzmglxrjgs6f4n4nn6gk25hubctoa"
value:
text:
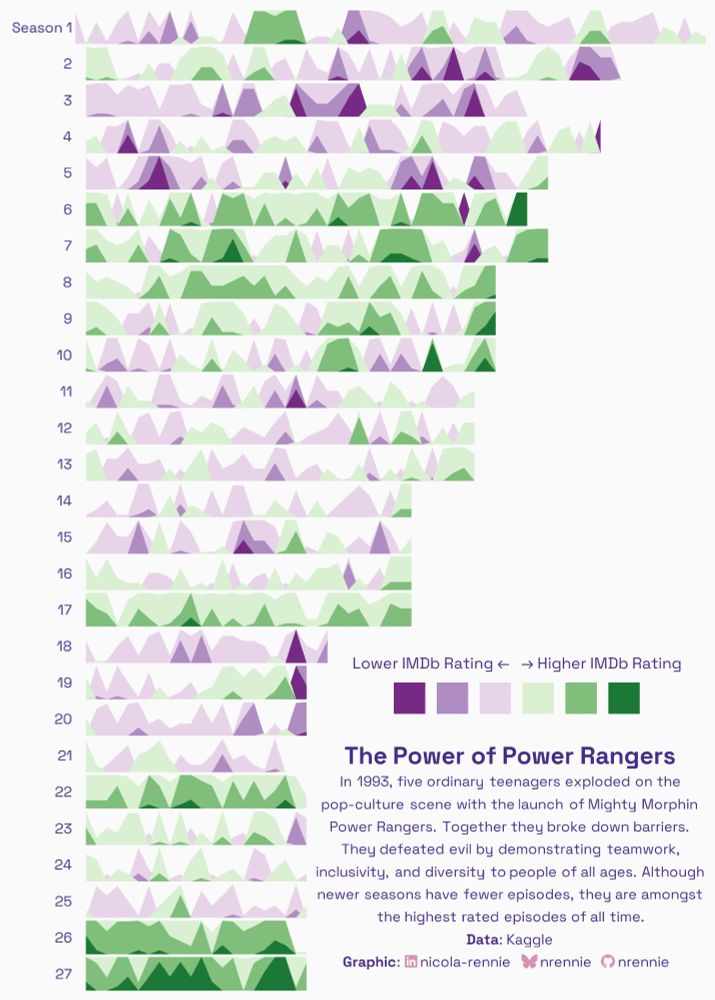
"We're looking at rating of Power Rangers episodes for #TidyTuesday this week! 🌅 Horizon plot made using {ggHoriPlot} 🎨 Colours from colorbrewer ✍️ Text formatted with {ggtext} Code: github.com/nrennie/tidy... #RStats #DataViz #ggplot2 #DSLC"$type:
"app.bsky.feed.post"
embed:
$type:
"app.bsky.embed.images"
images:
alt:
"Horizon chart showing episode ratings for each season of Power Rangers. Seasons 6-10, 17, and 27-28 appear more popular."
image:
View blob content
$type:
"blob"
mimeType:
"image/jpeg"
size:
446916
aspectRatio:
width:
1429
height:
2000
langs:
"en"
facets:
index:
byteEnd:
66
byteStart:
54
features:
tag:
"TidyTuesday"
$type:
"app.bsky.richtext.facet#tag"
index:
byteEnd:
220
byteStart:
194
features:
$type:
"app.bsky.richtext.facet#link"
index:
byteEnd:
229
byteStart:
222
features:
tag:
"RStats"
$type:
"app.bsky.richtext.facet#tag"
index:
byteEnd:
238
byteStart:
230
features:
tag:
"DataViz"
$type:
"app.bsky.richtext.facet#tag"
index:
byteEnd:
247
byteStart:
239
features:
tag:
"ggplot2"
$type:
"app.bsky.richtext.facet#tag"
index:
byteEnd:
253
byteStart:
248
features:
tag:
"DSLC"
$type:
"app.bsky.richtext.facet#tag"
createdAt:
"2024-08-29T13:46:37.474Z"