Author: eshekhova.bsky.social (did:plc:hr3l7o7uqw6detpw7os4ykmx)
Collections
Record🤔
cid:
"bafyreieubylj3r2e2o6jqcndmwaiu7n3jz7fmwpi65a4ezsnmwcne5wz3u"
value:
text:
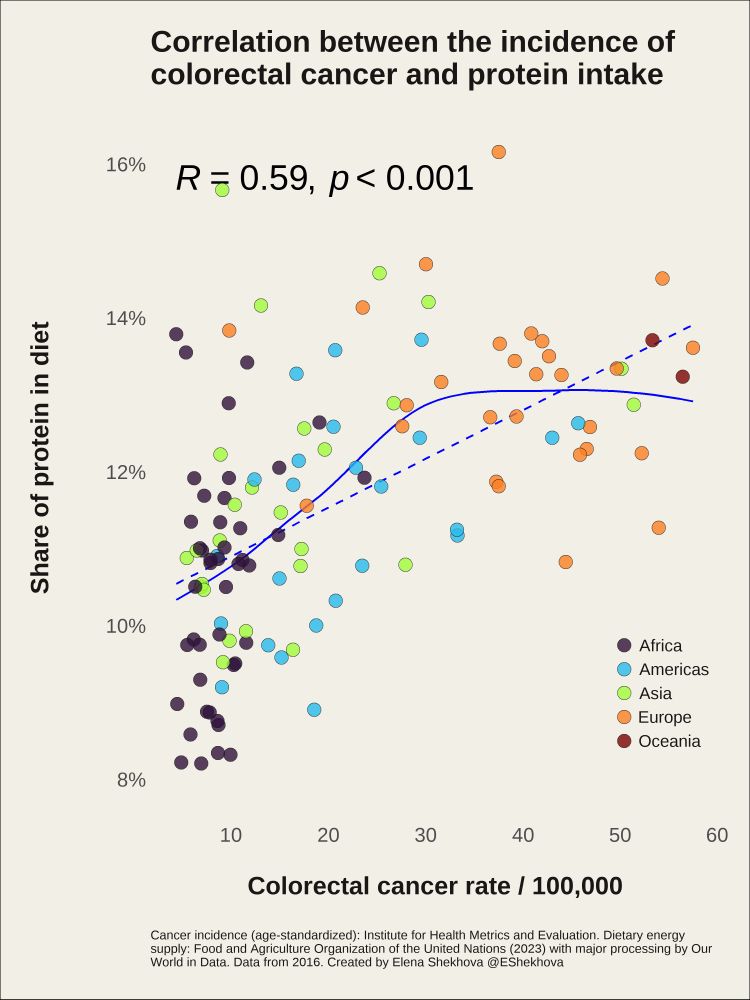
"#rstats 📊
I found this cool package called smplot2 by Seung Hyun Min.
It allows you to quickly add statistical results from correlation analysis to ggplots.
Only one line is needed to add the R- and p-values, along with a regression line, to the graph👍"
$type:
"app.bsky.feed.post"
embed:
$type:
"app.bsky.embed.images"
images:
alt:
"A graph produced in R using ggplot2 package, when R- and p values, along with regression line were added using smplot2 package"
image:
View blob content
$type:
"blob"
mimeType:
"image/jpeg"
size:
649719
aspectRatio:
width:
1500
height:
2000
alt:
"Code to add statistical results to the plot: sm_statCorr(color = "blue", corr_method = "spearman", linetype = "dashed", show_text = TRUE, text_size = 12)"
image:
View blob content
$type:
"blob"
mimeType:
"image/jpeg"
size:
105959
aspectRatio:
width:
1553
height:
85
langs:
"en"
facets:
index:
byteEnd:
7
byteStart:
0
features:
tag:
"rstats"
$type:
"app.bsky.richtext.facet#tag"
createdAt:
"2024-08-16T10:53:19.309Z"