Author: helenajambor.bsky.social (did:plc:h2yt756rgcukiejnd7wra6jx)
Collections
Record🤔
cid:
"bafyreieyyvln7jvnpappar4f3q6wy6mp75fzelxwnuqv5you4rtmdcxdpy"
value:
text:
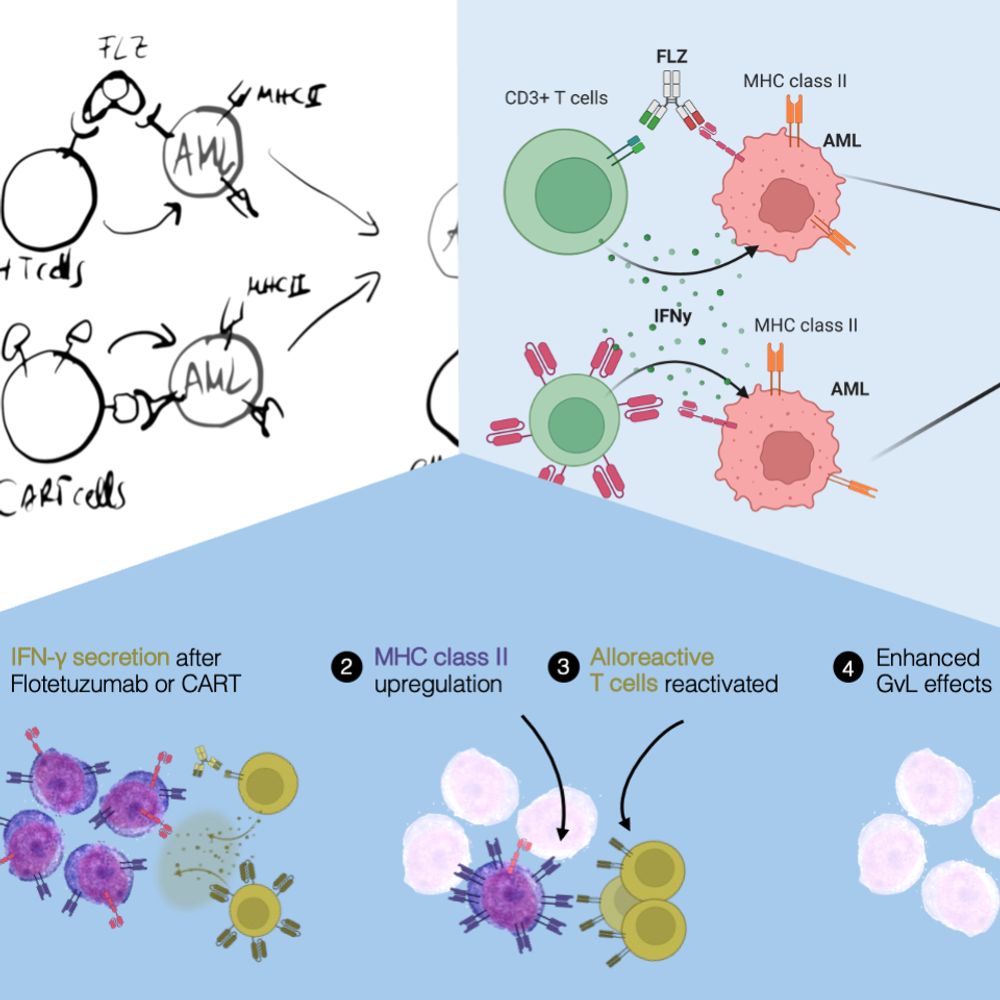
"🧪 Friends, help friends design great Graphical Abstracts!

10 steps, from idea to completion:
journals.plos.org/ploscompbiol...

#Visualization #DataVisualization #SciComm"
$type:
"app.bsky.feed.post"
embed:
$type:
"app.bsky.embed.images"
images:
alt:
"3 stages of a GraphicalAbstract / Visual summary / Infographic: top left, hand-drawn in black and white, top right, contains color, better annotation, and professional icons, bottom, final stages with pretty colors and creative use of icons."
image:
View blob content
$type:
"blob"
mimeType:
"image/jpeg"
size:
403910
aspectRatio:
width:
960
height:
960
langs:
"en"
facets:
index:
byteEnd:
132
byteStart:
99
features:
$type:
"app.bsky.richtext.facet#link"
index:
byteEnd:
148
byteStart:
134
features:
tag:
"Visualization"
$type:
"app.bsky.richtext.facet#tag"
index:
byteEnd:
167
byteStart:
149
features:
tag:
"DataVisualization"
$type:
"app.bsky.richtext.facet#tag"
index:
byteEnd:
176
byteStart:
168
features:
tag:
"SciComm"
$type:
"app.bsky.richtext.facet#tag"
createdAt:
"2024-02-13T17:59:23.605Z"