Record🤔
cid:
"bafyreig5tflxlwgs2n3mcsb5uzwqotnx4z2nt56acfypjqfz75qvily6rm"
value:
text:
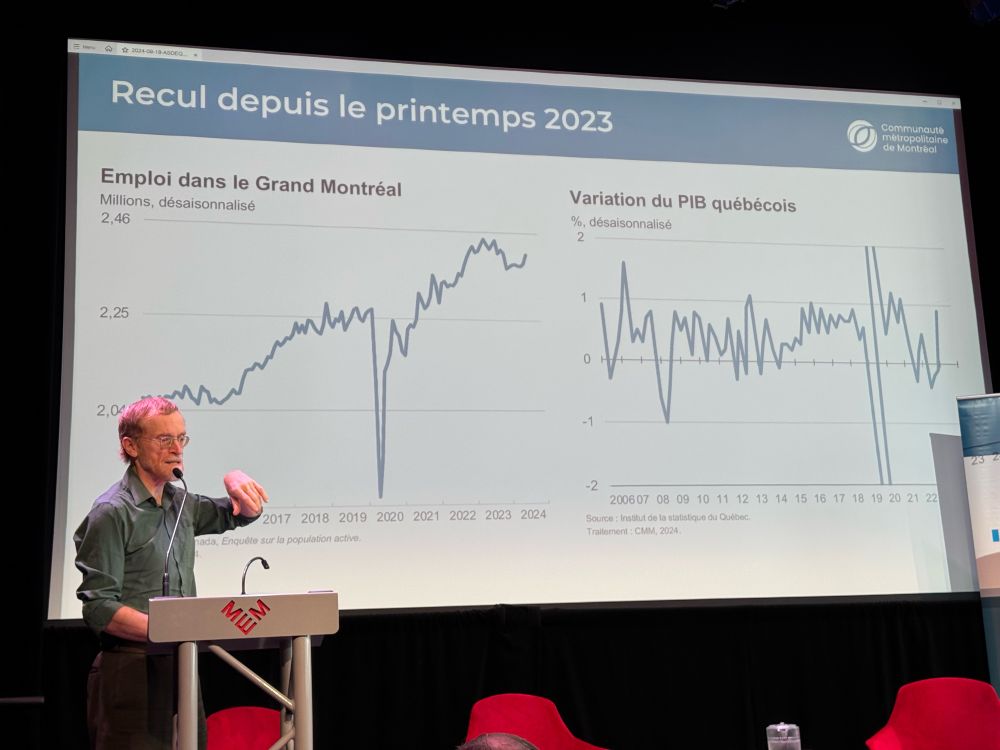
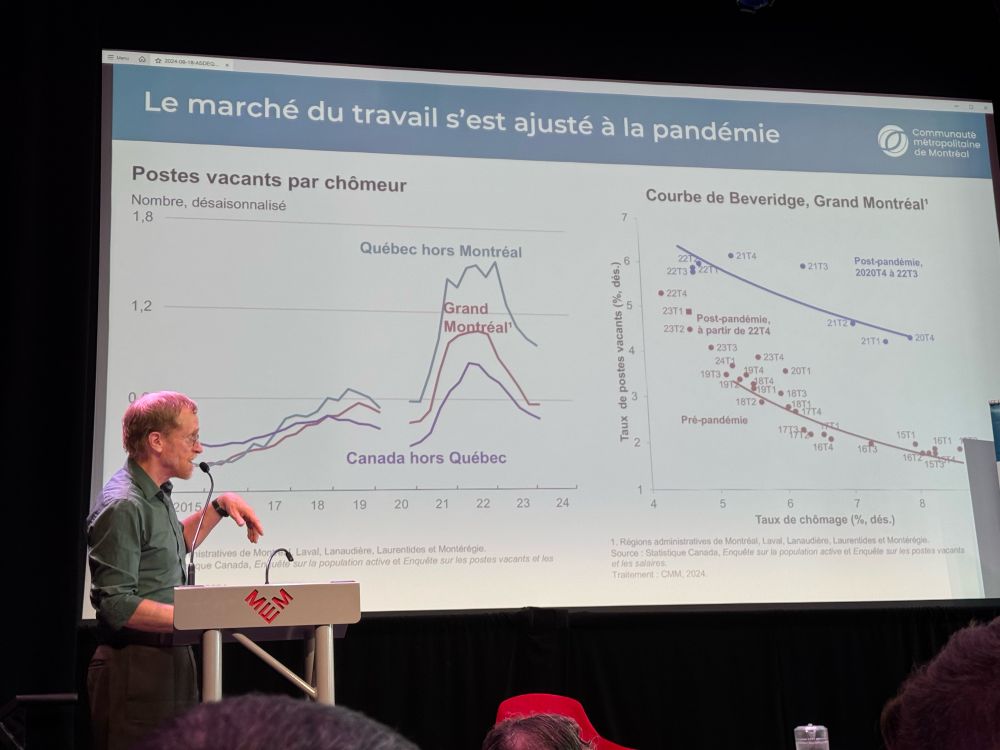
"Went to a conference about Montreal yesterday and reflected on the ways to deal with COVID data.

In one case, the speaker left the drop. In the other, he removed the time period — which I find quite good. 📊

We should have more discussions and examples about this in the dataviz community."
$type:
"app.bsky.feed.post"
embed:
$type:
"app.bsky.embed.images"
images:
alt:
"A speaker standing at a lectern (not a podium) in front of a big screen displaying two line charts. In both cases, 2020 is shown as a sharp drop."
image:
View blob content
$type:
"blob"
mimeType:
"image/jpeg"
size:
540777
aspectRatio:
width:
2000
height:
1500
alt:
"A speaker standing at a lectern (not a podium) in front of a big screen displaying a line charts where there is a gap (no lines) in 2020 to avoid distorting the chart with COVID outlier data."
image:
View blob content
$type:
"blob"
mimeType:
"image/jpeg"
size:
595163
aspectRatio:
width:
2000
height:
1500
langs:
"en"
createdAt:
"2024-09-19T12:27:21.853Z"