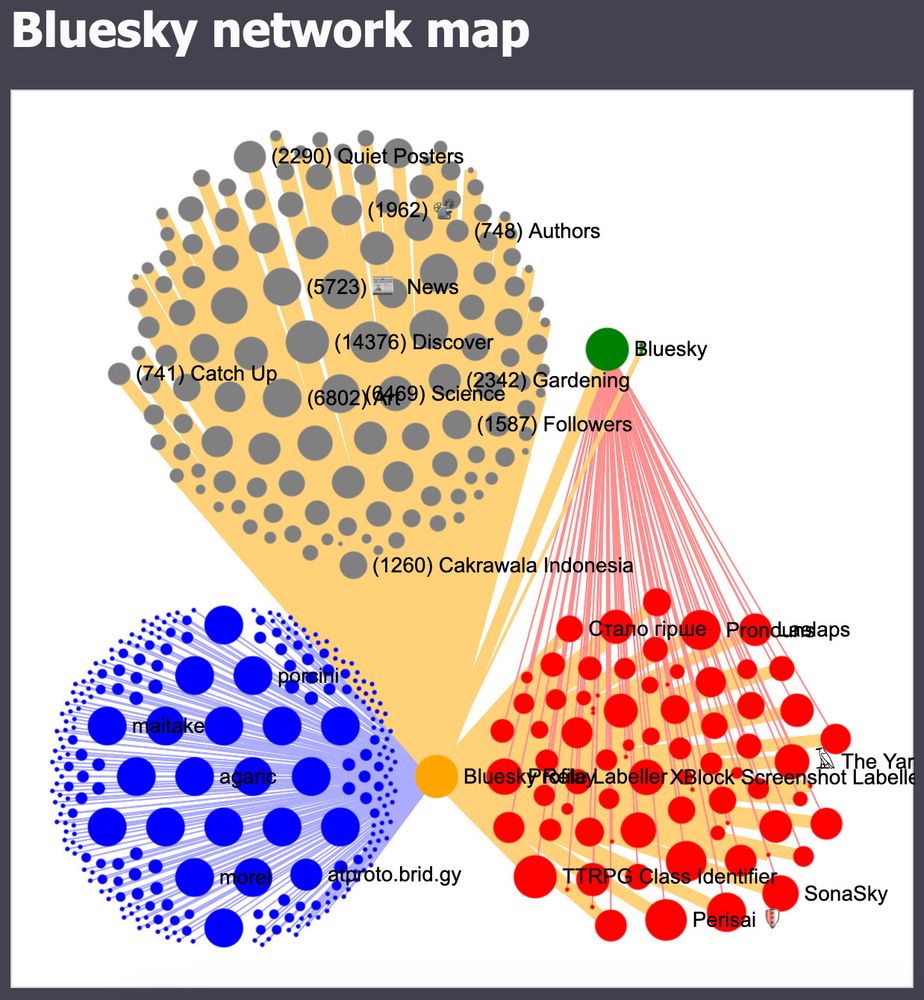
"Bluesky network map.

At the bottom left is a cloud of blue dots of different sizes, each corresponding to a PDS (storage server). The biggest dots are the PDSs run by Bluesky PBC.

At the bottom right is a cloud of red dots, each corresponding to a Labeler (such as a moderation service).

At the top left is a cloud of grey dots, each corresponding to a Feed.

At the top right are four green dots, each corresponding to a known AppView. The largest is Bluesky, while the other three (Frontpage, Smoke Signal, and White Wind) are very tiny.

A single orange dot in the middle corresponds to the Relay (run by Bluesky PBC).

There are blue lines joining the PDSs to the Relay, orange lines joining the Relay to the Labelers, Feeds, and AppViews, and red lines from the Labelers to the Bluesky AppView (as the other AppViews don't currently appear to hydrate from Labelers).

The orange lines from the Relay are sized based on the amount of data that the other end is consuming."