Author: str4d.xyz (did:plc:bvdrfwiamgi5leqs63q2duro)
Collections
Record🤔
cid:
"bafyreig5hvbxmebxa27n5y5tpvfr3gwejqcp6abr7dnv3ud5rocq6nuxsm"
value:
text:
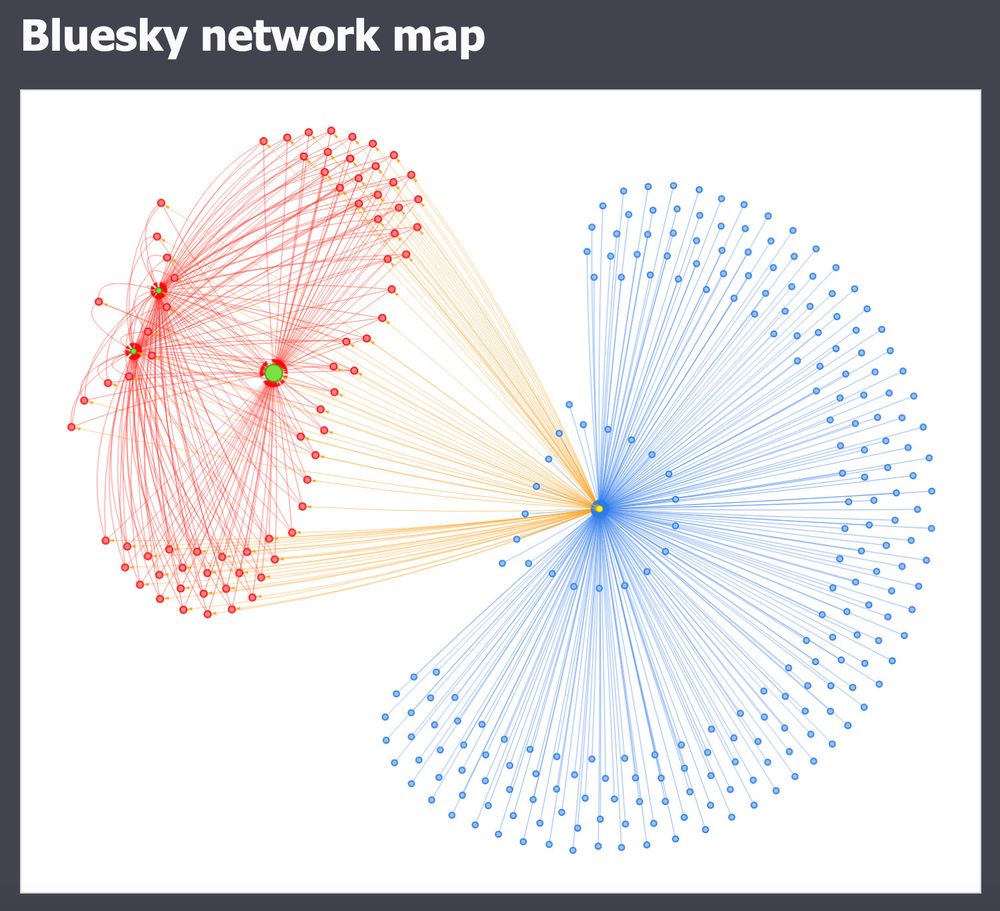
"I'm trying to come up with a nice way to visualize the Bluesky / ATProto network as it currently exists.

This shows PDSs (blue) and labelers (red) (thanks @mackuba.eu for the data snapshot), along with the relay (yellow), and known appviews (green: @bsky.app, @whtwnd.com, and @smokesignal.events)."
$type:
"app.bsky.feed.post"
embed:
$type:
"app.bsky.embed.images"
images:
alt:
"Bluesky network map. A single yellow dot labeled "Bluesky Relay" is surrounded by a half-circle made up of hundreds of blue dots corresponding to PDSs, joined to the yellow dot with blue lines. Emerging from the other side of the yellow dot is a bunch of orange lines pointing to dozens of red dots corresponding to labelers, that surround three green dots for the appviews Bluesky, White Wind, and Smoke Signal."
image:
View blob content
$type:
"blob"
mimeType:
"image/jpeg"
size:
633283
aspectRatio:
width:
1502
height:
1368
langs:
"en"
facets:
$type:
"app.bsky.richtext.facet"
index:
byteEnd:
167
byteStart:
156
features:
$type:
"app.bsky.richtext.facet#mention"
$type:
"app.bsky.richtext.facet"
index:
byteEnd:
259
byteStart:
250
features:
$type:
"app.bsky.richtext.facet#mention"
$type:
"app.bsky.richtext.facet"
index:
byteEnd:
272
byteStart:
261
features:
$type:
"app.bsky.richtext.facet#mention"
$type:
"app.bsky.richtext.facet"
index:
byteEnd:
297
byteStart:
278
features:
$type:
"app.bsky.richtext.facet#mention"
createdAt:
"2024-08-26T02:44:57.239Z"